
Maps: Action Plans visualisation
Maps: Action Plans visualisation
Maps is an open-source knowledge mapping spa (single page application) developed by the CNRS’ French Institute for Complex Systems Paris Île-de-France (ISC-PIF) and its partners. This platform provides interactive and simplified cartographic visualisations for exploring a corpus of textual documents.
The Maps visualisation interface provides a cartographic representation of the concepts identified in these plans.
Through a webpage, Maps provides an exploratory tool designed to guide users through the navigation, analysis, and interpretation of concepts extracted from action plans. It functions as both a semantic and relational space, enabling users to:
- Explore thematic clusters based on keywords (e.g., open science, evaluation criteria, peer review, diversity)
- Analyse shared concepts across documents by examining co-occurrence
Here you can directly navigate in the mapping page (via an iframe):
ⓘ See the navigating instructions
The Maps visualisation of Coara’s action plans can be accessed directly here:
View the map directly on the root page content(opens in new tab)
Example: Maps visualisation with 289 Action Plans (June 2026)
The main focuses of Coara action plans across organisations[1] are the question of assessment of scholars’ production and the management of their career, both taking into account the diversity of scholars’ activities and the necessity to develop qualitative metrics and make responsible use of quantitative ones.
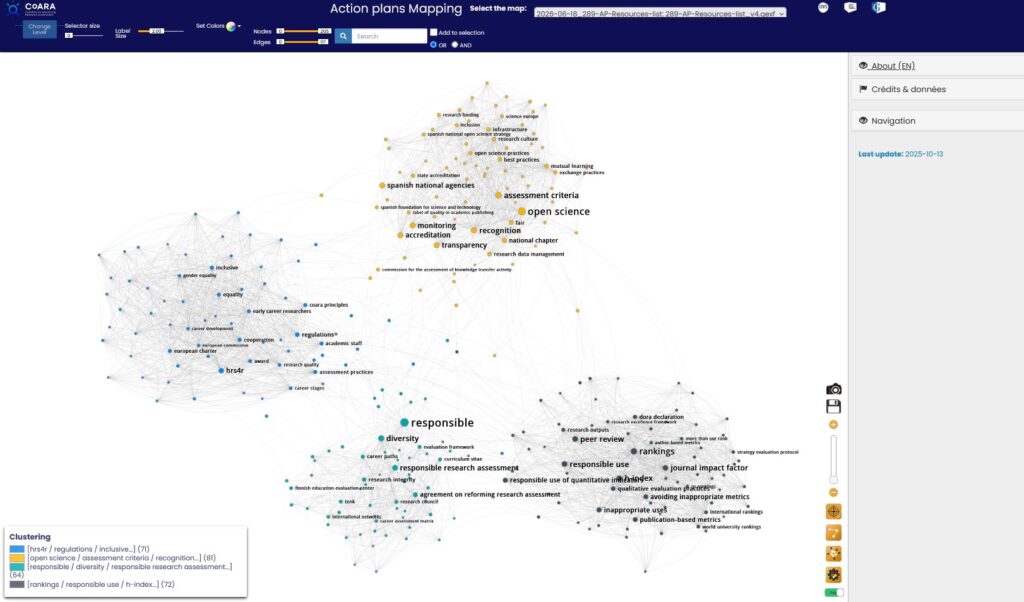
Maps visualisation: thematic cluster with 289 Action Plans
Four main areas emerge from the co-word analysis of Coara Action Plans. They can be grasped by their specific key concepts and the way they interact in the action plans. Exploring the data helps identify useful resources and guides for everyone, with updates informed by new evaluation criteria – and vice versa.
[1] Organisation type: Universities, and their associations ; Research centres, research infrastructures, and their associations ; Academies, learned societies, and their associations, and associations of researchers ; Public or private research funding organisations and their associations ; National/regional authorities or agencies that implement some form of research assessment and their associations ; Other relevant non-for-profit organisations involved with research assessment, and their associations.
Cluster No.1: « Research Culture and Policies »
This cluster focuses on European stakeholders and international networks involved in shaping open science policies. It explores charters and codes of conduct to make research more equitable and collaborative
Can be related to Commitment: 1, 6 and 10
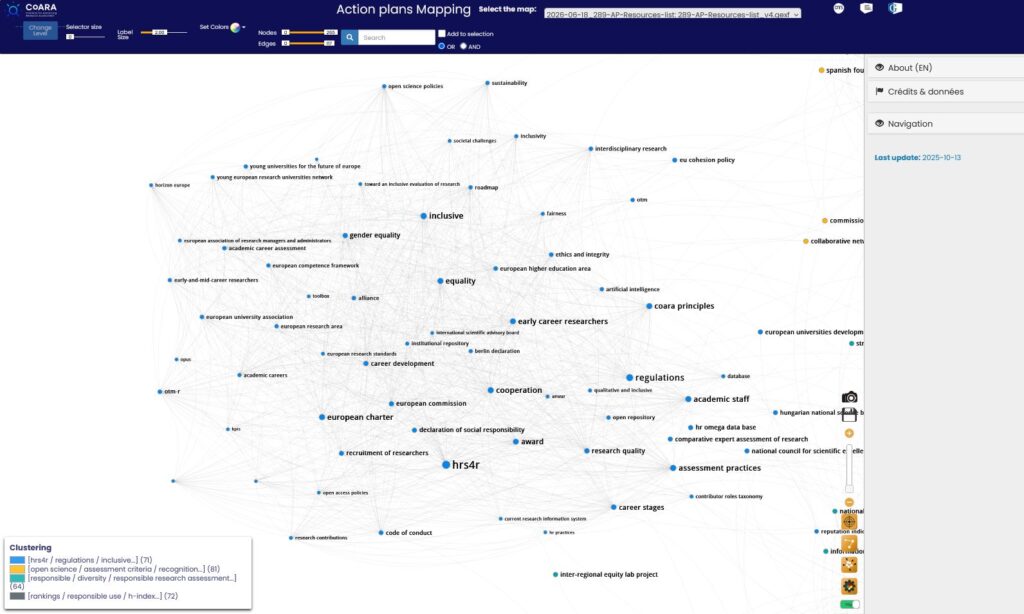
View cluster No.1 « Research Culture and Policies »
| Subset | Keywords | Resources |
| Subset 1.1 | Equality
Inclusive Ethics and integrity Code of conduct Regulations Societal challenges |
|
| Subset 1.2 | Early career researchers
Mid-career researchers Academic career assessment Academic staff Career stage |
HRS4R
OTM-R |
| Subset 1.3 | Open sciences policies
EU cohesion policy European charter European Commission European research area European University Association Cooperation European competence framework |
Horizon Europe
Berlin Declaration |
Cluster No.2: « Open Science Practices »
This cluster emphasises the core values of open science, evolving evaluation criteria, transparency, FAIR principles, and methods for reform at both European and national levels. It aims to facilitate the sharing of research practices and foster mutual learning.
Can be related to Commitment: 1, 5, 7 and 9
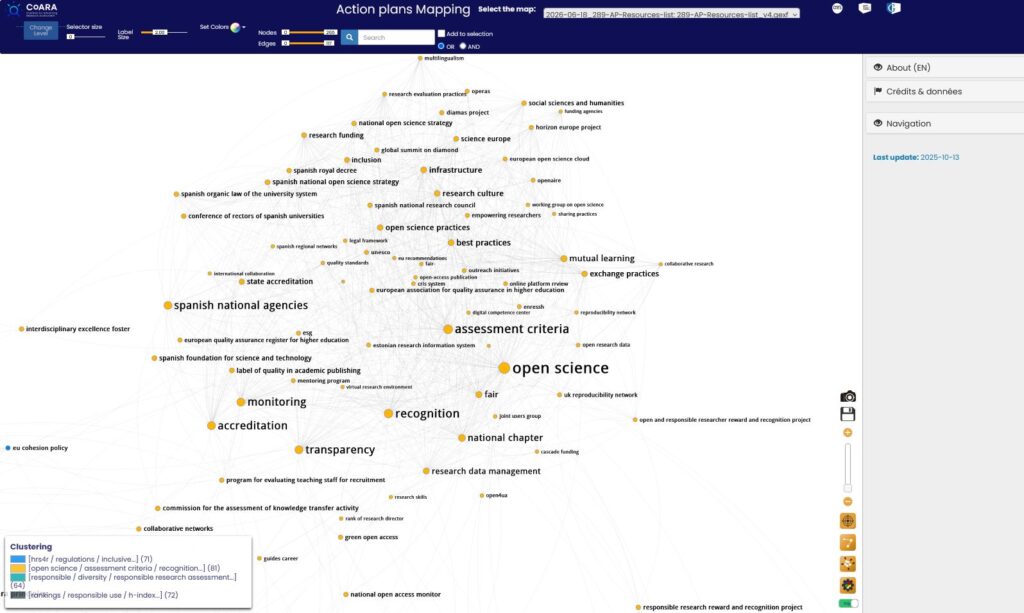
View cluster No.2 « Open Science Practices »
| Subset | Keywords | Resources |
| Subset 2.1 | Assessment criteria
Accreditation Monitoring Recognition Transparency Inclusion Legal framework |
|
| Subset 2.2 | Open science practices
Best practices Mutual learning Exchange practices Collaborative research Collaborative networks Research skills |
FAIR Principle
UNESCO EOSC |
Cluster No.3: « Indicator and Ranking »
This cluster highlights qualitative peer review methods, the importance of diverse metrics, and the rejection of legacy metrics.
Can be related to Commitment: 2, 3 and 4
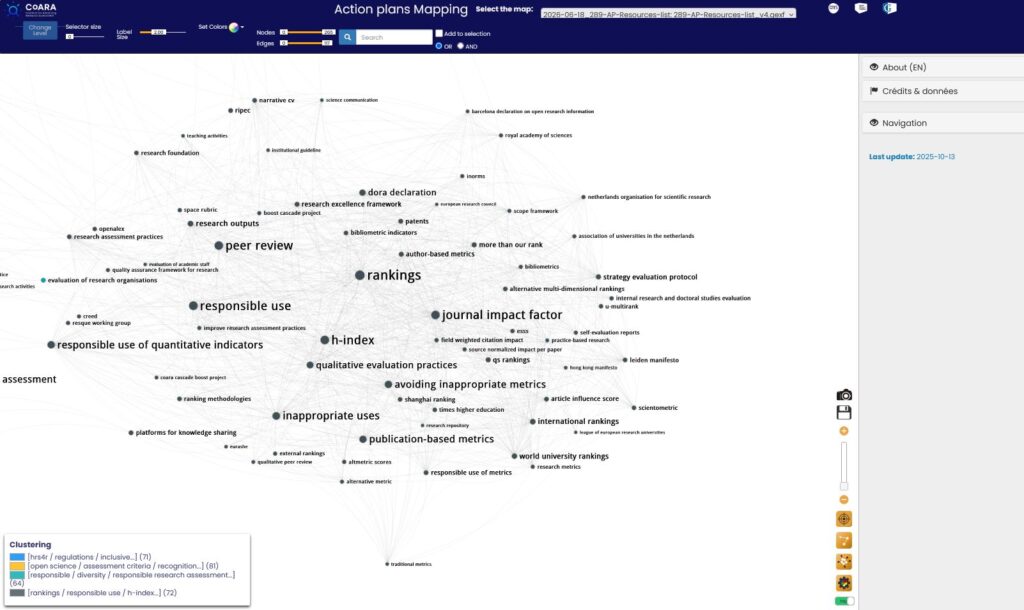
View cluster No.3 « Indicator and Ranking »
| Subset | Keywords | Resources |
| Subset 3.1 | Inappropriate uses
Journal Impact Factor H-Index Article influence score Publication-based metrics Scientometric bibliometric indicator |
|
| Subset 3.2 | Responsible use of metrics
Responsible use of quantitative indicators Qualitative peer review Research excellence framework Research outputs Peer review |
Dora declaration
Leiden manifesto Hong-Kong Manifesto Barcelona Declaration |
| Subset 3.3 | Ranking
International Ranking Ranking methodologies |
More than our rank
Shanghai ranking QS ranking |
Cluster No.4: « Responsible Assessment »
This cluster focuses on evaluating scientists’ careers, mentioning institutions that manage careers and the inclusion of research outputs and societal impact in assessments.
Can be related to Commitment: 1, 5, 6, 8 and 9
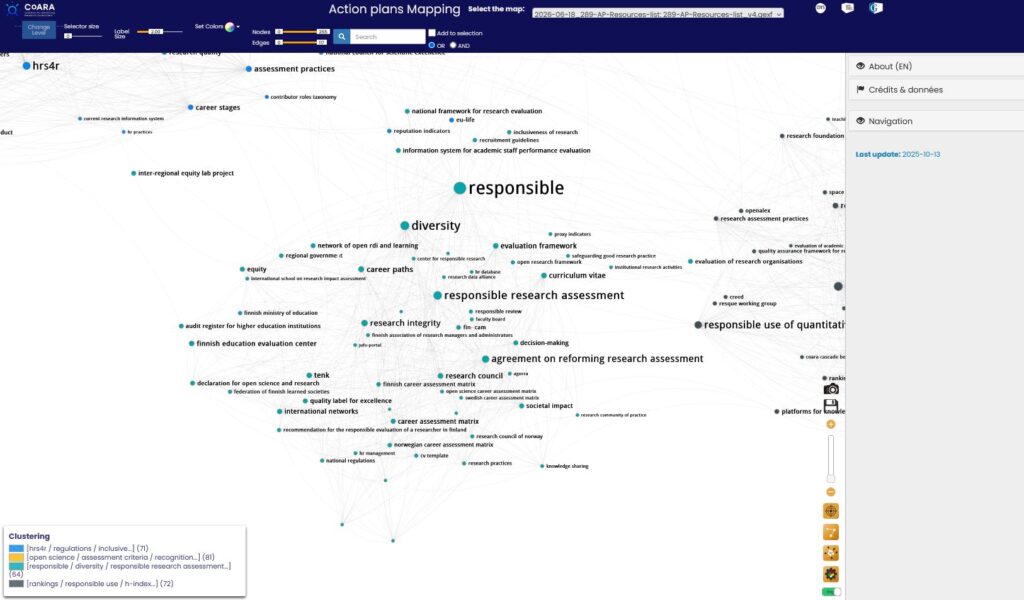
View cluster No.4 « Responsible Assessment »
| Subset | Keywords | Resources |
| Subset 4.1 | Responsible research assessment
Research Integrity Agreement on reforming New assessment criteria |
Declaration for open science and research |
| Subset 4.2 | Career assessment matrix
career paths Evaluation framework Curriculum vitae HR management Recruitment guidelines |
Open science career assessment matrix
Norwegian career assessment matrix Finnish career assessment matrix Swedish career assessment matrix CV template Tenk |
| Subset 4.3 | Diversity
Research integrity Equity Societal impact Knowledge sharing knowledge exchange Inclusiveness of research |
How to read the graph on Maps
🠅 Return to the interactive map
Introduction
Maps is the chosen visualisation tool, enabling any user to navigate the maps produced by GarganText in a simple yet comprehensive way, without requiring a GarganText platform account.
The Maps web page is designed to explore one or more graphs created in GarganText (to be selected from the dropdown list). Each graph visible in Maps is first exported from GarganText in GEXF (Graph Exchange XML Format) and accompanied by the original corpus.
The Maps interface therefore focuses on graph visualisation and directly provides options and filters to enhance usability. It also allows access to the texts behind each information provided on the graph.
Navigation and basic Interactions
- Click on a node to select it and display associated information.
- Cumulative selection of multiple terms is possible (use the “Add to selection” option or hold the “Shift” key).
- Use the mouse wheel to zoom in and out.
- Click and drag the background to move around the map.
- Search function to identify a map term
Clustering legend
- The legend located at the bottom left displays the main thematic groups identified in the corpus.
- Each colour represents a cluster of terms (identified using the Louvain method for community detection). Refreshing the page will generate a new random colour distribution for each cluster. The clusters highlight major areas of action
Interface example
Maps interface: Global map of action plans
The graph illustrates the co-occurrence of terms extracted from the Action Plans by GarganText:
- Nodes (dots) represent terms or keywords extracted from the Action Plans.
- Node size is proportional to the number of documents in which a term appears.
- Links between nodes indicate that the terms frequently appear together in the same documents (co-occurrences).
- Distance reflects the strength of the connection between nodes: terms that are closer are more strongly linked within the corpus.
Document Exploration
The right-hand column allows users to navigate between map concepts cited together and browse the texts from which the selected terms are extracted:
| Parameter | Description |
| Related column | Displays concepts cited alongside the selected terms, ranked by frequency of co-occurrence in the texts. |
| Docs displayed | Shows the full text of the Action Plans where the selected terms appear. Users can directly access the corresponding records on Zenodo. |
| Export as CSV button | Generates a CSV file containing the full-text documents linked to the terms selected on the map. |
Filtering sliders allow users to adjust the number of nodes and links displayed, revealing either the global structure or finer relationships:
Graphics parameters toolbar
The main toolbar provides several features to modify the map’s graphical parameters:
| Parameter | Description |
| Change level | Isolate a subset based on a selection of terms. (see Fig.12) |
| Selector size: | Adjust the selection area size |
| Label size | Adjust the size of node labels (terms) |
| Set colors | Choose the visualisation model (default: Louvain clustering). |
| Nodes | Display nodes based on the number of occurrences. |
| Edges | Display links between nodes based on connection strength. |
| Search | Search for a word or concept in the map. |
| Add to selection | Combine terms using Boolean parameters “AND” or “OR” (depending on the “search” field). |
The secondary toolbar provides several features to modify the map’s visualisation parameters:
| Parameter | Description |
| Take photo | Capture a screenshot of the visualisation screen |
| Save as | Save an export of the map in Gexf format |
| Zoom +/- | Adjust the zoom level |
| Center view | Recenter the map |
| Force atlas layout | Improve cluster separation |
| Disperse overlapping nodes | Prevent node and label overlap. |
| Facet coloring option | Choose the visualisation model |
| Edges | Toggle the display of links between terms |
Focus on a Subset
The « Change level » button temporarily switches from the global view to a local view, centered only on the selected nodes and their immediate connections.
This feature facilitates the exploration of a specific theme without visual noise, while retaining access to the overall context.