
Lodex platform
Lodex platform
Lodex is an open-source tool for processing, enriching and distributing datasets. It enables source data to be cross-referenced to produce customized graphical visualizations and offers interactive navigation on a website page.
The Lodex workflow enables to add new data whenever necessary, and then it automatically displays the processes and the enrichments on updated visualisations. Lodex offers dashboards that are run again each time a new file is submitted.
Lodex also offers a simple way of integrating text mining processes via a connection with all the advanced processing available on the ISTEX – TDM platform (services.istex.fr).
* Lodex is an open-source tool developed by the CNRS’ Institute of Scientific and Technical Information (Inist). You can use, modify, and/or redistribute the software under the terms of the CeCILL license (https://fr.wikipedia.org/wiki/Licence_CeCILL(opens in new tab)).
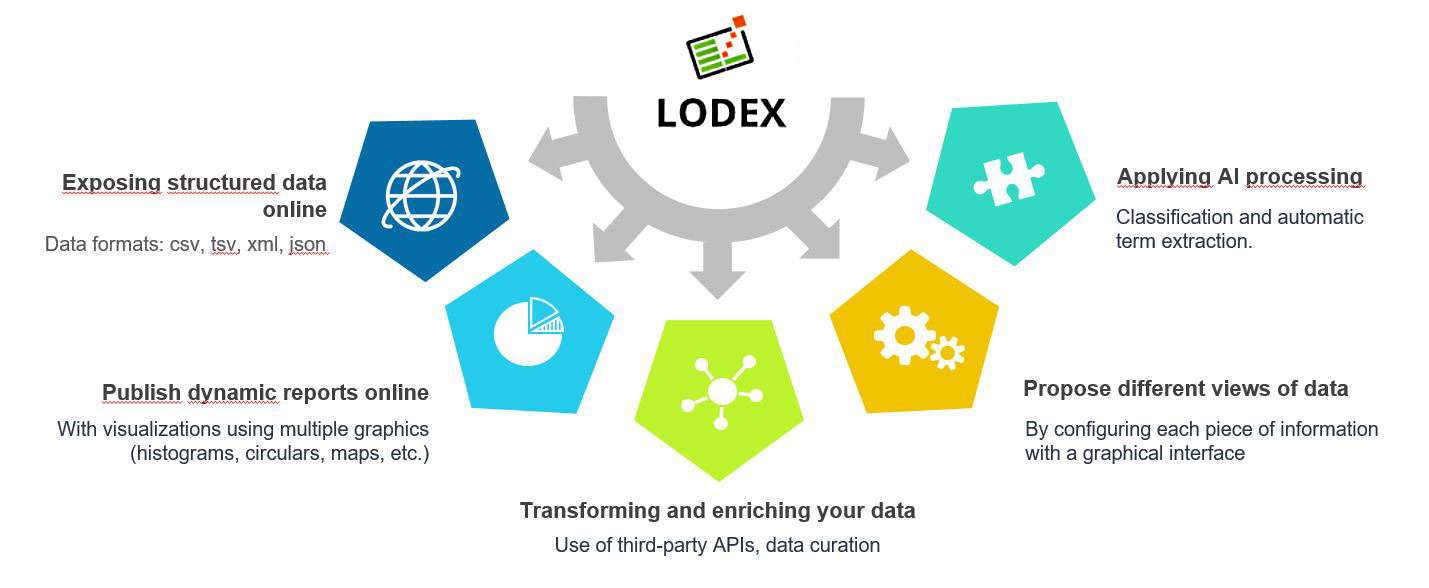
Lodex for CoARA’s Action Plans
For CoARA, Lodex was used to process the data sets (texts) extracted from the action plans. By cross-referencing the textual data, Lodex generates custom visualisations and enables selective querying on the provided website: https://lodex.istex.fr/instance/cnrs-coara-wp3/
See below “Instructions for navigating the graphs”
World Mapping
Below is a heatmap showing the distribution of action plans by country in the world
ⓘ See the navigating instructions
European Mapping
Below is a heatmap showing the distribution of action plans by country in Europe
ⓘ See the navigating instructions
Organisation Type
Below is a pie chart showing the number of action plans by organisation type
ⓘ See the navigating instructions
Action Plans by country
Below is a histogram showing the number of action plans by country
ⓘ See the navigating instructions
The previous iframes – “World Mapping”, “Action Plans by Country” and “Organisation Type” – are sourced from the Lodex platform.
The Lodex platform, which provides an analysis of Coara’s action plans, can be accessed directly here:
View the Lodex Platform directly on the root page content ↗(opens in new tab)
Instructions for navigating the graphs
Filters (each graph allows filtering the data):
Facets and a search box are associated with each graph, allowing you to filter information. This makes it possible to vary the values in a chart using these filters (Graphs).
These facets are located on the left side of the page. To cross-reference the information in a graph with the information in one or more facets, select the items to include in the filter (by checking the box(es) to the left of the items) or to exclude (by also checking the “exclude” box above the items). You can search for facet values by typing freely in the dedicated area above the items. You can cross-reference results by clicking on several different facets, but within the same facet, the responses are added together. After selection, the graphs are updated, and the cross-reference criteria appear at the top of the page.
You can also use the « search box » to filter the graphs with a keyword. The graph will display the number of action plans using the keyword.
The action plans linked to the query can be visualised by clicking on « Browse results » see below.
Export the graph
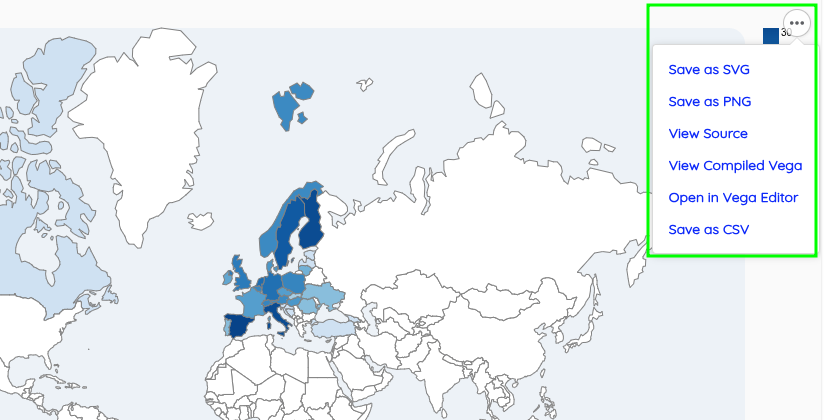
Click on the “three dots” button at the top right of the graphic to export each graph as a picture (PNG format), or as a html format (SVG) or as a CSV format (to get the data behind the graph).
Browse results (banner below the graph)
From the graph page, action plans that match the selected criteria are displayed by clicking on the « Browse Results » banner below the graph.
We recommend to always check the filter applied by viewing the results at the top of the page.
For information, the counts of values of action plans in the table showing the facets are fixed; they do not vary according to a filter.
- Search (at the top of browse menu)
You can also search by entering your search criteria as an expression in the « Enter your search here » window. - Exports
The Export button at the top of the Search page allows you to export records, either all of them or those resulting from a filter (in CSV format, etc.).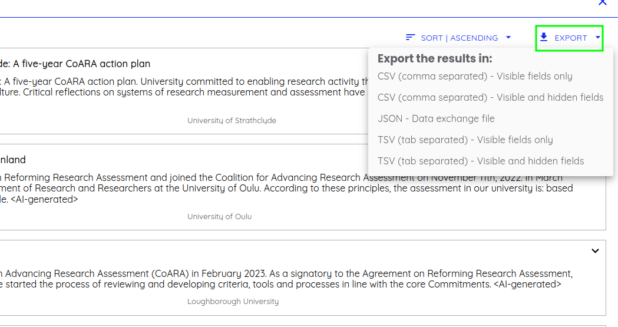
- Quit the « Browse results » mode
Click on the top banner to quit the Browse results mode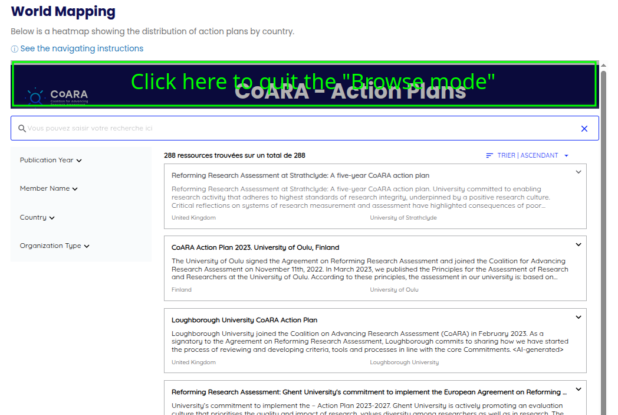
Navigation buttons (at the bottom of the page)

The navigation buttons at the bottom of the page: Home – Graphs – Search do not provide any further information; they simply allow you to navigate the LODEX website. We therefore recommend that you open the link in a new tab by clicking HERE ↗
|
Menu |
Description |
|
Home |
Takes you back to the home page. You will leave the graph in question. The home page displays all the available graphs. The graphs can be viewed in detail by clicking on the « Browse Results » banner (at the bottom of each graph) |
|
Graphs |
Allows you to view all the graphs in the report |
|
Search |
Presents a list of all publication references, which can be sorted by various criteria. Clicking on one of the references takes you to the publication record details. You can navigate from record to record using the left and right arrows. Within a record, it is also possible to access the Publisher record via the publication’s DOI, when available, and sometimes the full text of the publication |
The « View more » button is reserved for site administrators ( ).
).
The complete documentation for the Lodex tool is available at the following address: https://www.lodex.fr/docs/documentation/ or https://github.com/Inist-CNRS/lodex